
In recent years, we have observed a trend in the market where it has become increasingly appropriate to apply profit split methods. This shift is largely driven by the growing complexity of value creation within multinational enterprises (MNEs). Moreover, one of the main principles of the Base Erosion and Profit Shifting (BEPS) initiatives is the taxation of value creation, which has pushed MNEs to more carefully consider value creation and contributions thereto by group entities.
Profit split methods are often selected as the most appropriate transfer pricing model in two key situations: first, when multiple entities contribute significantly to value creation within an MNE, and second, when unique and valuable contributions are made by different entities that cannot be reliably priced using traditional transactional methods.
In these cases, identifying value drivers becomes crucial, as they play a key role in determining how profits are allocated among different entities. However, we see that companies frequently struggle to correctly identify value drivers. In addition, the identification of value drivers is inherently subjective. Strengthening value driver selection through the use of a value driver tree, as well as introducing an objective element, can help improve arm's length profit allocation and enhance the robustness of transfer pricing policies based on the profit split method.
This article is written by Michael Kratz ([email protected]), Hendrik Bastiaans ([email protected]), and Rafaël van der Wal ([email protected]). Michael, Hendrik, and Rafaël are part of RSM Netherlands International Tax Services with a focus on Transfer Pricing.
Using the Value Driver Tree
A practical tool to help identify and focus on these drivers is the "value driver tree." This tool provides a precise visual framework that breaks down the contributions to value drivers by multiple entities and how these elements interconnect. By mapping out the relationships between various business processes, companies can clearly identify how each contributing entity plays a role in value creation.
Creating a Value Driver Tree
Figure 1: Example of a typical value driver tree
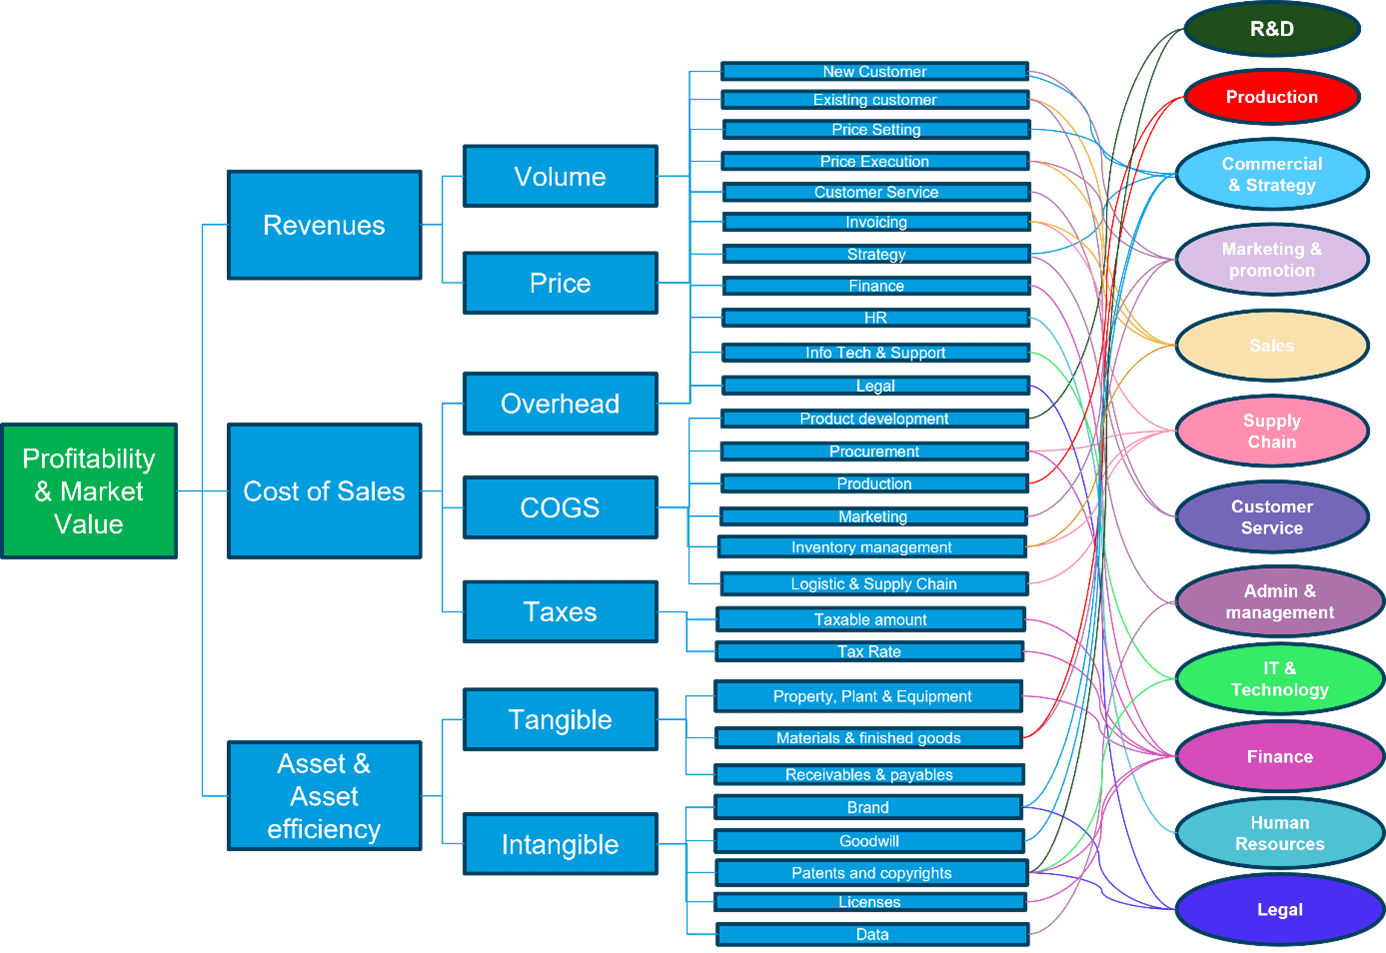
An example of a typical value driver tree is provided in the figure above. When constructing a value driver tree, it is important to begin by categorizing the major elements that contribute to overall profitability and market value. Start by identifying the main value drivers such as revenues, cost of sales, and asset & asset efficiency. Each of these main drivers should then be broken down into smaller, actionable components that directly impact these areas, such as volume, price, overhead, and cost of goods sold.
Linking Value Drivers to Organizational Functions
The next step involves linking each sub-driver to the specific functions and departments within the Group that contribute to these value drivers. For instance, price setting and customer service may drive revenue, while production and procurement may impact cost of sales. The value driver tree visually maps these relationships and assigns accountability across different departments (which could be spread across several group entities) like R&D, production, sales, and supply chain.
Assigning Weights to Value Drivers
This visual representation helps clarify how each function and entity contributes to the creation of value, thus simplifying the process of understanding how profits (where the profit split method is to be applied) should be allocated among different contributing entities within a multinational enterprise. Once value drivers are identified, it is essential to assign an appropriate weight to each, ensuring that the weights add up to 100. This allows for a balanced allocation of profits based on the significance of each value driver.
Introducing Objectivity to Value Driver Analysis
While the value driver tree helps us understand how profits are created, it remains a subjective exercise. To enhance its precision, we can layer in an objective allocation key. For example, if one of the value drivers is increasing sales volumes in North America, an allocation key could be based on the salaries of sales personnel pursuing business development and performing sales activities for the North American market, or individuals in the head office setting sales strategy for North America. Similarly, if the value driver is supply chain efficiency, the focus would be on the salaries of individuals in the procurement, production, and logistics departments.
Forward Thinking in Transfer Pricing
Based on our experience, Dutch (and other) tax authorities increasingly favour a contribution analysis to allocate profit when the profit split method is appropriate, as it provides a more nuanced approach than an allocation solely based on metrics like cost contribution.
The main drawback of this approach is the subjectivity in identifying value drivers, which complicates the allocation process and often leads to incorrect identification of the source of real value creation. By introducing a structured approach based on a value driver tree as well as objective elements, such as allocation keys tied to measurable metrics like salaries or specific departmental costs, an MNE can develop a more practical and precise framework for the allocation of profits among entities contributing towards value creation.
RSM is a thought leader in the field of Transfer Pricing. We offer frequent insights through training and sharing of thought leadership based on a detailed knowledge of industry developments and practical applications in working with our customers. If you want to know more, please contact one of our consultants.